Page 1 of 9
AFL Statistics

Posted:
Wed Jun 08, 2016 3:37 pmby bennymacca
I thought I would create a new thread
Some of you find statistics interesting, some of you probably think I am being a massive David King and think its all a load of rubbish. If thats the case feel free to skip this thread
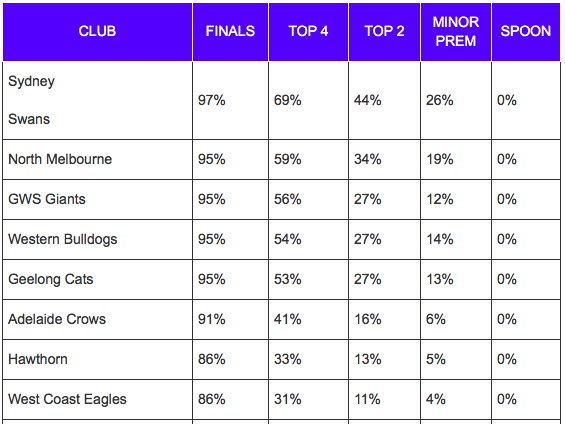
Champion Data have released the chances of each team making top 8/4/2/1 and the wooden spoon.
- Screen Shot 2016-06-07 at 4.55.02 PM.png (57.09 KiB) Viewed 4042 times
- Screen Shot 2016-06-07 at 4.55.14 PM.png (41.9 KiB) Viewed 4042 times
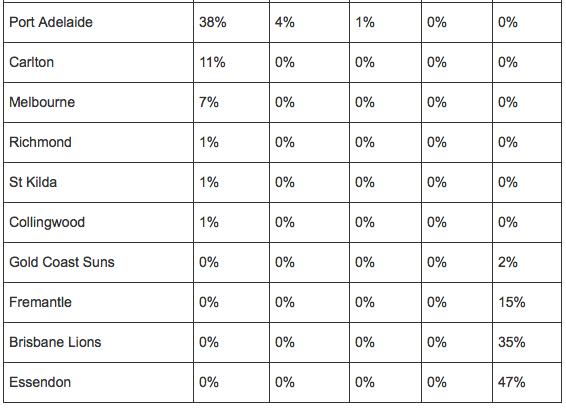
It doesnt make great reading for teams lower than Port, but also shows they are well and truly still in with a finals chance.
The other thing that stood out to me was how low they rated Hawthorn's top 4 chances.
Re: AFL Statistics
Posted:
Wed Jun 08, 2016 3:45 pmby Corona Man
Interesting stuff. I guess what these stats don't take into account is past history. I'm the first to admit the Hawks are well down on what we saw at times last year. To me it's what improvement we have in us post mid season break. Our turn around last year following the West Coast finals loss was huge. Stats, as good as they are, can't predict that.
Re: AFL Statistics
Posted:
Wed Jun 08, 2016 3:46 pmby The Bedge
Big difference between the current top 8's finals chances and Ports!
Re: AFL Statistics
Posted:
Wed Jun 08, 2016 3:59 pmby bennymacca
Zartan wrote:Big difference between the current top 8's finals chances and Ports!
Yep, and I think that matches with perception. Port are definitely around the mark but even though they are playing decent footy, they are the clear 9th best team for mine. Would take a big drop in form, or some big injuries from one of the top 8 teams for them to force their way in
Re: AFL Statistics
Posted:
Wed Jun 08, 2016 4:53 pmby valleys07
That percentage will change should we beat the Dogs this weekend.
As it currently stands, its very much reflective of our form. 0-4 against the top 8 sides, 6-1 against the bottom 10. Can't argue with that.
Re: AFL Statistics
Posted:
Wed Jun 08, 2016 4:55 pmby Bum Crack
Geez I hope Nth end up top two. That is going to give a lot of teams real hope of winning a prelim, provided they're not in Sydney's side of the draw.
Re: AFL Statistics
Posted:
Wed Jun 08, 2016 5:05 pmby bennymacca
The North Geelong and Crows West Coast games will change the above significantly you would think
Re: AFL Statistics
Posted:
Wed Jun 08, 2016 6:42 pmby mighty_tiger_79
Well North and the Eagles are the winners of those matches
Re: AFL Statistics
Posted:
Wed Jun 08, 2016 6:50 pmby bennymacca
mighty_tiger_79 wrote:Well North and the Eagles are the winners of those matches
If only it were that simple!
Re: AFL Statistics
Posted:
Wed Jun 08, 2016 6:55 pmby mighty_tiger_79
It is.
Sent from my XT1562 using Tapatalk
Re: AFL Statistics
Posted:
Wed Jun 08, 2016 8:46 pmby bennymacca
Interesting stat from Kingy on 360
For Top 8 teams vs other Top 8 teams, the home team has won 14 of the 16 games.
So maybe we should be going for West coast and Geelong?
Re: AFL Statistics
Posted:
Wed Jun 08, 2016 8:48 pmby carey
bennymacca wrote:Interesting stat from Kingy on 360
For Top 8 teams vs other Top 8 teams, the home team has won 14 of the 16 games.
So maybe we should be going for West coast and Geelong?
I'm tipping them 2
Re: AFL Statistics
Posted:
Wed Jun 08, 2016 8:49 pmby mighty_tiger_79
The Dome is more a home game for the Roos.
And they will win
$2.15 into $1.90 and shortening as Dutchy and Spargo keep putting the cash
Re: AFL Statistics
Posted:
Wed Jun 08, 2016 8:49 pmby bennymacca
I think im going to go WC and North. Assuming Goldy is back. Hawkins out is a big loss i reckon
Re: AFL Statistics
Posted:
Wed Jun 08, 2016 8:55 pmby mighty_tiger_79
bennymacca wrote:I think im going to go WC and North. Assuming Goldy is back. Hawkins out is a big loss i reckon
The Hawkins loss isn't that bad as I have discussed with Johno via Twitter.
Hawkins has never really torn the Roos apart so it's not a huge loss in my view.
Plus we aren't that good. We are an average side and our 2nd tier players haven't really stood up consistently
I wish there were stats for that
Re: AFL Statistics
Posted:
Wed Jun 08, 2016 9:01 pmby Wedgie
Stats Insider:
How Western Bulldogs, Geelong Cats have been most hurt by inaccurate goalkicking, expected scores
by MAX LAUGHTONSource: FOX SPORTS
SOMETIMES the most simple things in footy are the most important.
For all of the planning pre game and in the coaches’ box, even the master tacticians of the AFL can’t help when their team just can’t kick straight.
For Western Bulldogs coach Luke Beveridge, that has been extremely apparent in 2016 — because his side should be undefeated.
Analysis from AFL stat gurus Champion Data reveals that nine games this season have been decided by goalkicking. They use a metric called ‘expected score’, which analyses each scoring shot based on difficulty and gives it a value based on how often you would expect a team to goal from that spot on the ground.
By comparing a game’s expected score to the actual score, we can then confirm what you can already see when you look at the scoreboard some weeks — teams that kick poorly while their opponents kick straight can cost themselves the game.
Remarkably, three of the nine matches decided this season by goalkicking were the Bulldogs’ three losses.
In all three of the Western Bulldogs’ losses in 2016, their inaccuracy (and the accuracy of their opponents) has cost them victory.
Against Hawthorn in Round 3, the Dogs fell by three points while recording two extra scoring shots — they should have won by seven points.
Then against North Melbourne in Round 6 it was the same story. The Bulldogs had one fewer scoring shot than the Kangaroos but had higher-quality chances, meaning in a game they lost by 16 points, they should have won by eight.
The Round 9 loss to GWS is perhaps the most surprising. The Dogs were seemingly soundly beaten, losing 15.8 (98) to 10.13 (73). But the visitors had same number of scoring chances as the Giants and better ones too, meaning that if they had kicked as expected, the Bulldogs would’ve gotten over the line by four points.
It’s not just the Bulldogs who have been impacted heavily by goalkicking though, with two fellow top four sides having wildly different seasons in front of goal.
THE TEAMS MOST HURT AND HELPED BY GOALKICKING
EVEN three weeks later, it’s still hard to figure out how Collingwood ran over premiership contenders Geelong.
The Magpies’ best win of the season saw them defeat the Cats by 24 points but in reality that result was just a microcosm of Geelong’s season.
If Geelong had kicked as expected, they would have beaten Collingwood by 10 points. That 34-point swing from expected to actual margin is tied for second for the biggest difference this season.
The largest change came in Round 2’s Showdown, when Adelaide won 22.12 (144) to Port Adelaide’s 11.20 (86). With average goalkicking by both sides, the Crows would have won 125 to the Power’s 105 — a swing of 39 points.
But overall, the Cats have been heavily impacted by both their inaccuracy and their opponents’ good work in front of goal this season, to the tune of nine points per game.
Geelong’s inaccuracy in front of goal, combined with accuracy from their opponents, has cost them nine points per game.
On average in 2016 Geelong has scored 4.5 points fewer than it should have and given up 4.4 points more than it should have, using expected goals to analyse scoring opportunities.
That places it second-last in the competition ahead of only Richmond. The Tigers have been average in front of goal but their opponents have kicked remarkably straight all season, costing them to the tune of nearly 10 points per match.
The best team in front of goal this season shouldn’t be too surprising — it’s been the same for a while now. Hawthorn’s accuracy is remarkably consistent and it has seen them average 8.8 points more per game than would be expected of an average side.
The two Sydney sides are second and third, with GWS scoring 8.2 more points per game than expected and the Swans averaging an extra 7.1 points more per game thanks to straight kicking.
In fact, comparing the Swans with Geelong makes for some surprising reading.
WHY THE CATS SHOULD BE CRUISING
FLYING high with the AFL’s best percentage, you wouldn’t be blamed for tipping Sydney as the flag favourite.
But if they can’t keep kicking straighter than usual — or if Geelong can stop missing — things may change.
Sydney’s average margin per game this season is +32.3, ranking first in the league. But thanks to their own straight kicking and some inaccuracy from opponents, they are adding an extra 9.3 points per game to their margin.
Instead, those inaccurate Cats should be ranking first for average margin. Their actual average is +29.2 when, with a conversion rate as expected, it would be +38.1.
Sydney has been helped by an extra nine points per game on average based on their own accuracy and other teams’ inaccuracy.
The two other sides most impacted by kicking for goal are Melbourne and Richmond, and they sit at opposite ends of the spectrum.
The Demons have added a goal per game more than you would expect based on straight kicking and their opponents’ inaccuracy has added another few points as well.
If things had just gone as expected then, Melbourne’s average margin per game wouldn’t be +4.9 and would instead be -3.6 — putting their percentage below 100 rather than at its current 105.1.
They’d be judged much differently if that was the case, as would Richmond if their opponents would stop slotting goals so easily.
On average in 2016 Richmond has lost by a margin of 18.5, but using expected goals, they should be losing by an average of 9.2 points per game. That would make their case for an unlikely finals run much more likely.
MATCH RESULTS IMPACTED BY GOALKICKING
Round 1 — North Melbourne def Adelaide Crows
Actual score: 107-97
Expected score: 93-98
Round 1 — Melbourne def GWS Giants
Actual score: 80-78
Expected score: 75-106
Round 2 — Collingwood def Richmond
Actual score: 87-86
Expected score: 82-94
Round 3 — Hawthorn def Western Bulldogs
Actual score: 93-90
Expected score: 85-92
Round 5 — Carlton def Fremantle
Actual score: 72-68
Expected score: 89-90
Round 6 — North Melbourne def Western Bulldogs
Actual score: 61-45
Expected score: 64-72
Round 9 — GWS Giants def Western Bulldogs
Actual score: 98-73
Expected score: 78-82
Round 9 — Collingwood def Geelong Cats
Actual score: 104-80
Expected score: 81-91
Round 9 — West Coast Eagles def Port Adelaide
Actual score: 94-86
Expected score: 95-95
Re: AFL Statistics
Posted:
Wed Jun 08, 2016 9:35 pmby bennymacca
Great stuff Wedgie, thats the sort of stuff I was hoping to get. Hadn't seen that article
We have always known how good a kicking team hawthorn is, but not a lot has been said about how that also translates to better goal kicking. 8.8 points per game above average purely due to goal kicking is a pretty huge swing.
Re: AFL Statistics
Posted:
Wed Jun 08, 2016 10:38 pmby Bum Crack
mighty_tiger_79 wrote:The Dome is more a home game for the Roos.
And they will win
$2.15 into $1.90 and shortening as Dutchy and Spargo keep putting the cash
Lol. U are bigger on the old reverse psychology than i am when it comes to Geelong. Have u picked the cats this year? I'm very confident we'll win this week.
Re: AFL Statistics
Posted:
Wed Jun 08, 2016 10:39 pmby Bum Crack
mighty_tiger_79 wrote:The Dome is more a home game for the Roos.
And they will win
$2.15 into $1.90 and shortening as Dutchy and Spargo keep putting the cash
Lol. U are bigger on the old reverse psychology than i am when it comes to Geelong. Have u picked the cats this year? I'm very confident we'll win this week.
Re: AFL Statistics
Posted:
Wed Jun 08, 2016 11:43 pmby LaughingKookaburra
Not a fan of shoulda, coulda, woulda in front of the sticks. If you're missing the goal then you're giving automatic possession to the opposition. How many goals did the opposition then kick from effectively turning the ball over and coughing up 5 points in the process? If you kick the goal the game then goes back to the middle and the entire course of the rest of the match changes.... Where were those shots taken, were they forced wide, outside the corridor when taking those shots?