
Up to the end of round 5 this is what each Leagues' teams are averaging.
As far as scoring shots per match, the SANFL is averaging 54.95 shots per match - both teams.
The AFL is averaging 51.40.
SANFL teams are averaging 104.05 pts, AFL teams 94.08 pts.
17 posts
• Page 1 of 1
SANFL teams are averaging 104.05 pts, AFL teams 94.08 pts.
![]() by spell_check » Sun Apr 30, 2006 11:40 pm
by spell_check » Sun Apr 30, 2006 11:40 pm
- spell_check
- Coach
-

- Posts: 18868
- Joined: Fri Oct 28, 2005 11:56 pm
- Has liked: 51 times
- Been liked: 255 times
![]() by Ecky » Sun Apr 30, 2006 11:47 pm
by Ecky » Sun Apr 30, 2006 11:47 pm
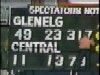
Hey Spelly, can you tell us the last time there was an 18 goal quarter in the SANFL (or AFL?)
(This happened today in the second quarter of Glenelg vs North)
(This happened today in the second quarter of Glenelg vs North)

![]() by spell_check » Sun Apr 30, 2006 11:54 pm
by spell_check » Sun Apr 30, 2006 11:54 pm
Round 4 2003 between South and Sturt.
- Code: Select all
Highest Aggregate Scores in a Quarter
         Home T.   Score         Away T.   Score         Q   Round   Year   Venue
21   6   132   South   10   2   62   Woodville   11   4   70   4   14   1984   Football Park
20   8   128   Port   13   6   84   South   7   2   44   2   2   1974   Adelaide
19   6   120   Norwood   7   3   45   Port   12   3   75   1   17   1936   Norwood
19   6   120   Central   9   1   55   Woodville   10   5   65   4   2   1985   Elizabeth
19   3   117   Sturt   5   0   30   Port   14   3   87   4   18   1990   Adelaide
19   3   117   South   8   0   48   Sturt   11   3   69   4   4   2003   Encounter Bay
18   8   116   West   15   7   97   Torrens   3   1   19   4   8   1982   Richmond
17   11   113   Port   14   6   90   Glenelg   3   5   23   4   3   1934   Alberton
18   4   112   West   14   3   87   Torrens   4   1   25   4   18   1984   Richmond
18   3   111   Norwood   7   1   43   North   11   2   68   1   5   1975   Norwood
17   9   111   Sturt   14   5   89   West   3   4   22   4   22   1980   Unley
18   3   111   Glenelg   8   1   49   North   10   2   62   2   5   2006   Glenelg
17   8   110   Central   10   2   62   West   7   6   48   4   22   1985   Elizabeth
17   8   110   Glenelg   8   3   51   Sturt   9   5   59   4   4   1986   Glenelg
17   7   109   Glenelg   13   6   84   Port   4   1   25   4   2   1976   Adelaide
17   7   109   South   11   4   70   Sturt   6   3   39   2   21   1981   Football Park
16   13   109   Glenelg   12   6   78   West   4   7   31   2   3   1987   Glenelg
18   1   109   North   2   1   13   Central   16   0   96   4   1   2003   Prospect
- spell_check
- Coach
-
- Posts: 18868
- Joined: Fri Oct 28, 2005 11:56 pm
- Has liked: 51 times
- Been liked: 255 times
![]() by spell_check » Sun Apr 30, 2006 11:55 pm
by spell_check » Sun Apr 30, 2006 11:55 pm
This is the AFLs' highest since 1990.
- Code: Select all
Highest Aggregate Scores in a Quarter
18   8   116   2   8   5   53   N.Melbourne   Sydney   10   3   63   6   1991   M.C.G
18   4   112   4   4   1   25   Brisbane   Geelong   14   3   87   7   1992   Carrara
18   2   110   1   9   1   55   Melbourne   N.Melbourne   9   1   55   5   1991   M.C.G
17   8   110   2   7   4   46   Fitzroy   N.Melbourne   10   4   64   22   1991   Princes Park
17   8   110   4   13   6   84   Brisbane   Fremantle   4   2   26   5   2001   Gabba
17   7   109   2   6   3   39   N.Melbourne   West Coast   11   4   70   1   2000   M.C.G
17   5   107   4   7   2   44   Sydney   Melbourne   10   3   63   15   1991   S.C.G
17   5   107   2   11   2   68   Carlton   W.Bulldogs   6   3   39   17   1998   Princes Park
16   10   106   3   9   2   56   N.Melbourne   Geelong   7   8   50   13   1992   M.C.G
16   5   101   3   5   2   32   Hawthorn   Carlton   11   3   69   4   1994   Waverley
15   7   97   4   5   3   33   W.Bulldogs   Richmond   10   4   64   17   2003   Docklands
14   12   96   1   5   8   38   Richmond   Sydney   9   4   58   4   1991   M.C.G
15   6   96   3   5   1   31   Richmond   Fitzroy   10   5   65   8   1992   M.C.G
15   6   96   4   8   4   52   Carlton   W.Bulldogs   7   2   44   13   2001   Princes Park
15   6   96   4   9   3   57   W.Bulldogs   Brisbane   6   3   39   18   2005   Docklands
15   5   95   4   4   1   25   Fitzroy   Hawthorn   11   4   70   6   1991   North Hobart
14   11   95   3   11   10   76   Hawthorn   Fitzroy   3   1   19   21   1991   Princes Park
15   5   95   4   13   3   81   N.Melbourne   Fremantle   2   2   14   10   2000   M.C.G
15   5   95   3   11   0   66   Brisbane   Carlton   4   5   29   16   2000   Gabba
15   5   95   3   5   2   32   Melbourne   West Coast   10   3   63   6   2003   M.C.G
- spell_check
- Coach
-
- Posts: 18868
- Joined: Fri Oct 28, 2005 11:56 pm
- Has liked: 51 times
- Been liked: 255 times
![]() by Ecky » Mon May 01, 2006 12:01 am
by Ecky » Mon May 01, 2006 12:01 am
Going by your stats then, it was the most goals EVER in a quarter involving Glenelg, and something which has not been seen at all in the AFL since 1992! 
![]() by spell_check » Mon May 01, 2006 12:14 am
by spell_check » Mon May 01, 2006 12:14 am
Ecky wrote:Going by your stats then, it was the most goals EVER in a quarter involving Glenelg, and something which has not been seen at all in the AFL since 1992!
Yes, didn't notice that. That's surprising considering the scores the 70s and 80s teams were racking up.
- spell_check
- Coach
-
- Posts: 18868
- Joined: Fri Oct 28, 2005 11:56 pm
- Has liked: 51 times
- Been liked: 255 times
![]() by Aerie » Mon May 01, 2006 12:55 am
by Aerie » Mon May 01, 2006 12:55 am
spell_check - do you know the efficiency ratings, i.e. how many kicks and/or posessions per goal for SANFL compared to AFL?

![]() by spell_check » Mon May 01, 2006 1:11 am
by spell_check » Mon May 01, 2006 1:11 am
AFL Kicks per goal - Total kicks - 16601 Total goals - 1094 = 15.17 avg.
SANFL Kicks per goal - Total kicks - 7355 Total goals - 542 = 13.57 avg. (Excluding North vs. Glenelg)
AFL Pos. per goal - Total pos. - 26777 Total goals - 1094 = 24.48 avg.
SANFL Pos. per goal - Total pos. - 11983 Total goals - 542 = 22.11 avg. (Excluding North vs. Glenelg)
SANFL Kicks per goal - Total kicks - 7355 Total goals - 542 = 13.57 avg. (Excluding North vs. Glenelg)
AFL Pos. per goal - Total pos. - 26777 Total goals - 1094 = 24.48 avg.
SANFL Pos. per goal - Total pos. - 11983 Total goals - 542 = 22.11 avg. (Excluding North vs. Glenelg)
- spell_check
- Coach
-
- Posts: 18868
- Joined: Fri Oct 28, 2005 11:56 pm
- Has liked: 51 times
- Been liked: 255 times
![]() by Pseudo » Mon May 01, 2006 11:10 am
by Pseudo » Mon May 01, 2006 11:10 am
Heck, spelly, is there anything you don't know?
How about the most number of goals kicked on the wrong foot into a 5 knot wind by a player wearing white shorts?
How about the most number of goals kicked on the wrong foot into a 5 knot wind by a player wearing white shorts?
Clowns OUT. Smears OUT. RESIST THE OCCUPATION.

![]() by Aerie » Mon May 01, 2006 11:39 am
by Aerie » Mon May 01, 2006 11:39 am
spell_check wrote:AFL Kicks per goal - Total kicks - 16601 Total goals - 1094 = 15.17 avg.
SANFL Kicks per goal - Total kicks - 7355 Total goals - 542 = 13.57 avg. (Excluding North vs. Glenelg)
AFL Pos. per goal - Total pos. - 26777 Total goals - 1094 = 24.48 avg.
SANFL Pos. per goal - Total pos. - 11983 Total goals - 542 = 22.11 avg. (Excluding North vs. Glenelg)
Thanks Spell_Check.
![]() by Jimmy » Mon May 01, 2006 11:52 am
by Jimmy » Mon May 01, 2006 11:52 am
well, the AFL is shit and only have one or two good, exciting games a round (thats including the ones caused by the umps not hearing sirens  )
)
SANFL is clearly more exciting to watch and follow.
SANFL is clearly more exciting to watch and follow.
Carn the blues!!!!!


![]() by spell_check » Mon May 01, 2006 2:24 pm
by spell_check » Mon May 01, 2006 2:24 pm
Pseudo wrote:Heck, spelly, is there anything you don't know?
How about the most number of goals kicked on the wrong foot into a 5 knot wind by a player wearing white shorts?
Only things that have been published. I doubt if I can find that stat published.
- spell_check
- Coach
-
- Posts: 18868
- Joined: Fri Oct 28, 2005 11:56 pm
- Has liked: 51 times
- Been liked: 255 times
![]() by giffo » Mon May 01, 2006 9:39 pm
by giffo » Mon May 01, 2006 9:39 pm
I like the bottom row of the SANFL stat sheet. 16 goals in a quarter by the one side!!
Fantastic though, this is what the crowds want to see, lots of goals and fast flowing football. Not this chip it sideways, backwards bloody rubbish.
On the down side though, one of my apprentices at work is a bit lethargic on Mondays after running the boundaries, as every game he has done so far has had roughly 40 goals scored. And spare a thought for the poor goal umpires, their arms might fall off from waving the flags so often.

![]() by spell_check » Mon May 01, 2006 10:15 pm
by spell_check » Mon May 01, 2006 10:15 pm
True, but I think to have been a boundary umpire in the 70s' and 80s' it would have been tough.
Particularly in 1985 when on average 35 goals and 27 behinds were scored each game!
That's 62.45 scoring shots avg. and 118.98 points per team!
Particularly in 1985 when on average 35 goals and 27 behinds were scored each game!
That's 62.45 scoring shots avg. and 118.98 points per team!
- spell_check
- Coach
-
- Posts: 18868
- Joined: Fri Oct 28, 2005 11:56 pm
- Has liked: 51 times
- Been liked: 255 times
![]() by pipers » Tue May 02, 2006 1:00 am
by pipers » Tue May 02, 2006 1:00 am
This is great stuff spelly/ecky.
Statistical confirmation that the "speed up the game at all costs" approach of the AFL is counter productive.
Long live the SANFL.
AFL will eat itself!
Hurrah! Hooray for gin!
Statistical confirmation that the "speed up the game at all costs" approach of the AFL is counter productive.
Long live the SANFL.
AFL will eat itself!
Hurrah! Hooray for gin!
"loyalty is dead"


![]() by phantompanther » Tue May 02, 2006 9:21 am
by phantompanther » Tue May 02, 2006 9:21 am
the footy has been great but one would have to admit the superior fitness of afl players allows them to have greater defensive capabilities. and hello teams, maybe not getting into a shootout is a better way to try and beat north adelaide
"what I have written I have written"
- phantompanther
- Mini-League
- Posts: 33
- Joined: Mon Nov 21, 2005 11:41 pm
- Has liked: 0 time
- Been liked: 0 time
![]() by doggies4eva » Tue May 02, 2006 9:25 am
by doggies4eva » Tue May 02, 2006 9:25 am
I think the stats show that in AFL there is more close checking, more flooding and more careful working out of defence moves than SANFL.
We used to be good :-(
-

doggies4eva - League - Best 21
-

- Posts: 2473
- Joined: Mon Dec 05, 2005 2:23 pm
- Location: In front of a computer screen
- Has liked: 0 time
- Been liked: 0 time
17 posts
• Page 1 of 1